What is Call History? Call History (Agent Conversations) displays all historical conversations with your agents. View performance metrics, listen to recordings, read transcripts, and access raw execution data for debugging and analysis.
How to Access Call History
From Sidebar
Click Call History in the left navigation menu.
From Agent Setup
Click See all call logs in the actions panel.
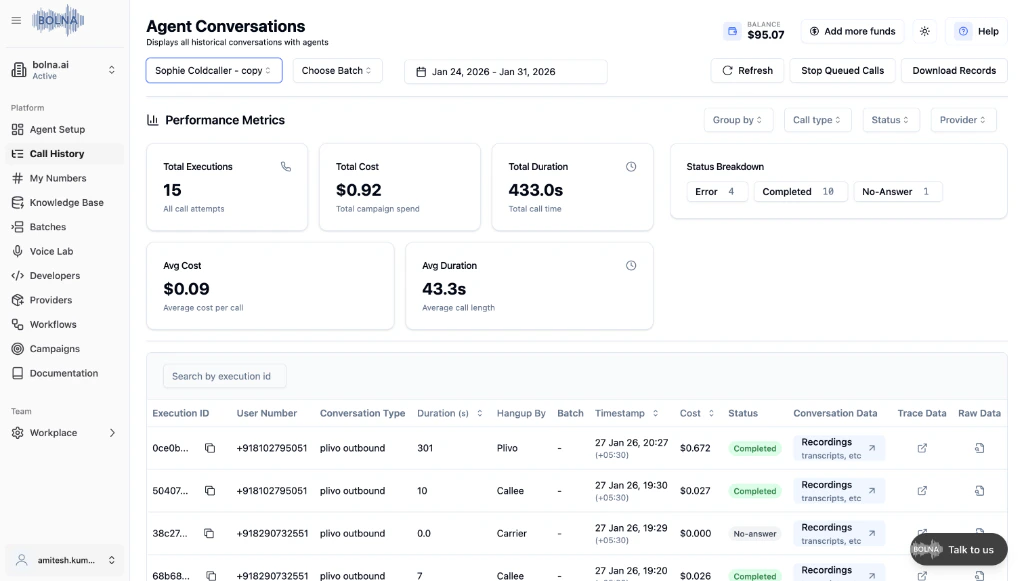
The top section displays real-time metrics for your selected agent and date range. Use these to monitor campaign performance at a glance.
Metric Description Total Executions Total number of call attempts Total Cost Total campaign spend Total Duration Total call time in seconds Status Breakdown Count of Error, Completed, and No-Answer calls Avg Cost Average cost per call Avg Duration Average call length
Filtering Calls
Filter Description Agent Select a specific agent to view its calls Batch Filter by batch campaign Date Range Choose a date range for the calls Group By Group calls by different criteria Call Type Filter by inbound or outbound calls Status Filter by Completed, Error, or No-Answer Provider Filter by telephony provider
Use the search by execution ID box to quickly find a specific call.
Call Table Each call is displayed with the following information:
Column Description Execution ID Unique identifier for the call User Number Phone number of the caller/recipient Conversation Type Type of call (plivo outbound, twilio inbound, etc.) Duration (s) Call duration in seconds Hangup By Who ended the call (Callee, Carrier, Plivo, etc.) Batch Batch campaign if applicable Timestamp When the call occurred Cost Cost of the call Status Call status (Completed, No-answer, Error)
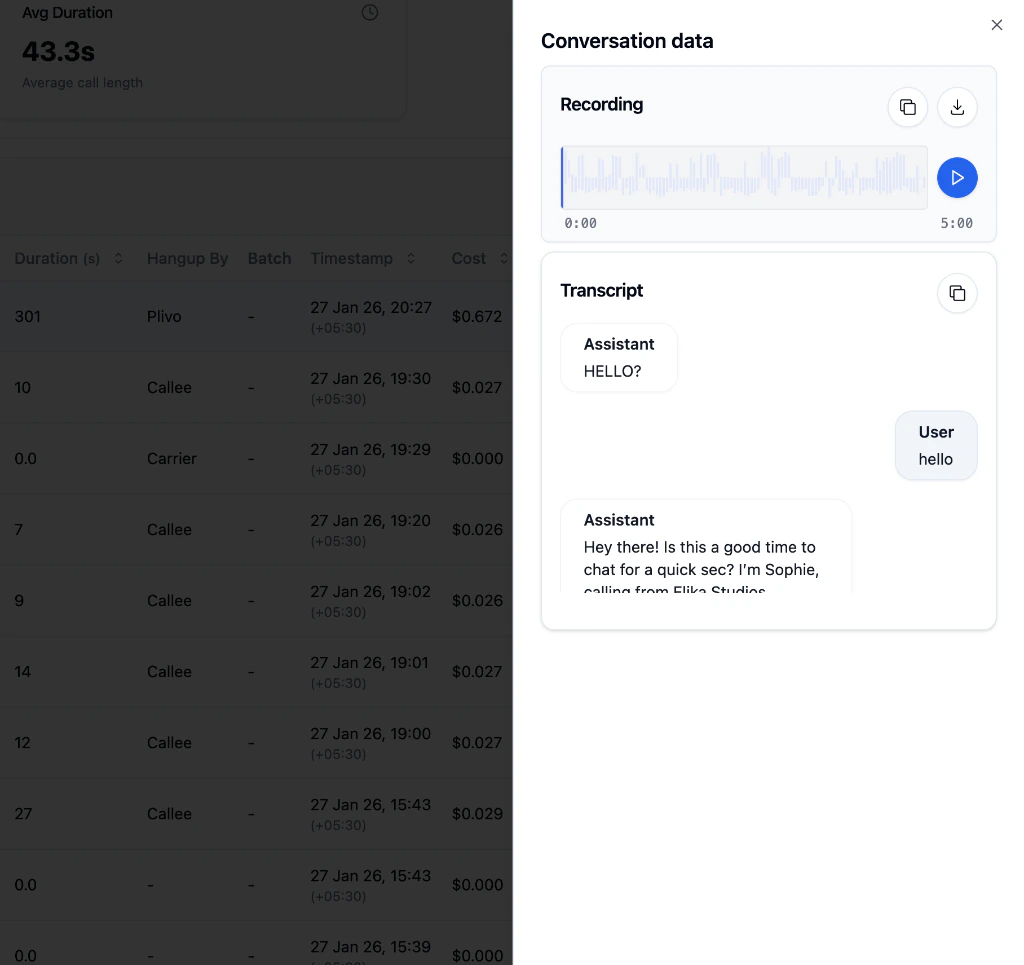
Call Details Conversation Data
Trace Data
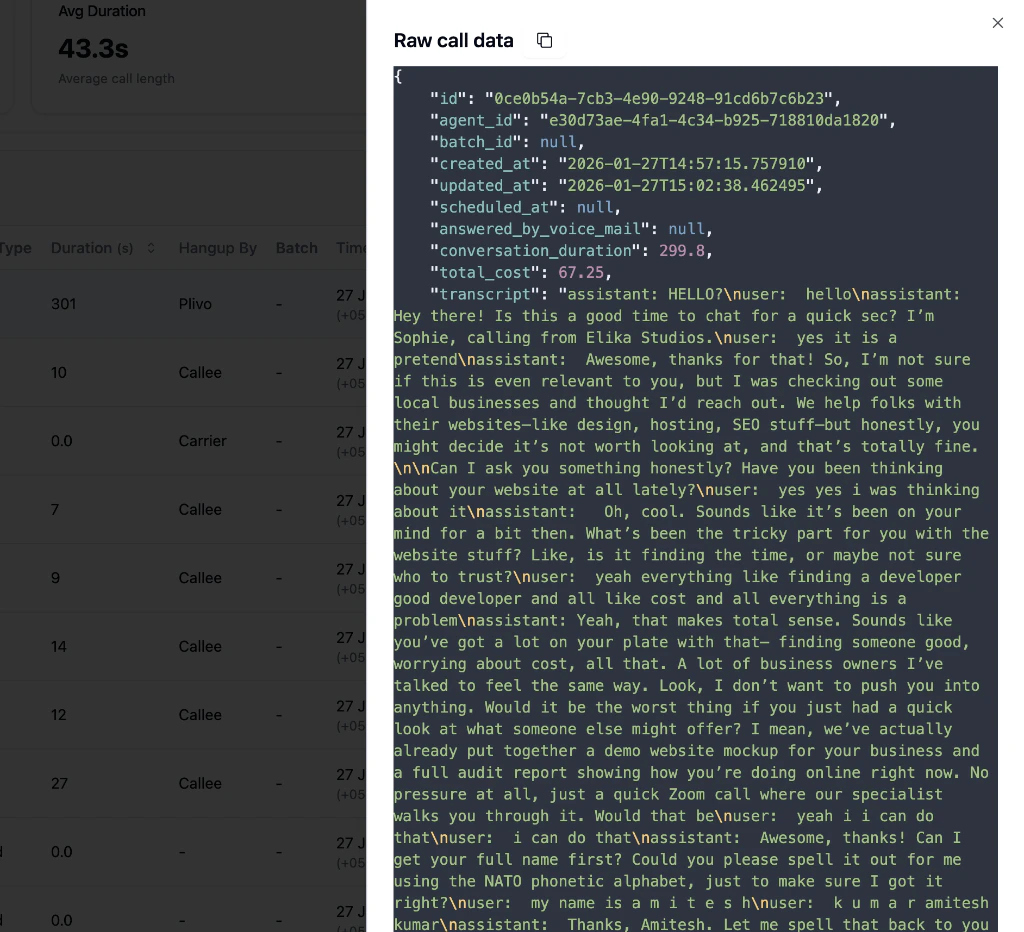
Raw Data
Click Recordings, transcripts, etc to view the full conversation data. Section Description Recording Audio waveform with play, copy, and download options Transcript Full conversation showing Assistant and User messages
Use the copy button to quickly copy the recording URL or transcript text.
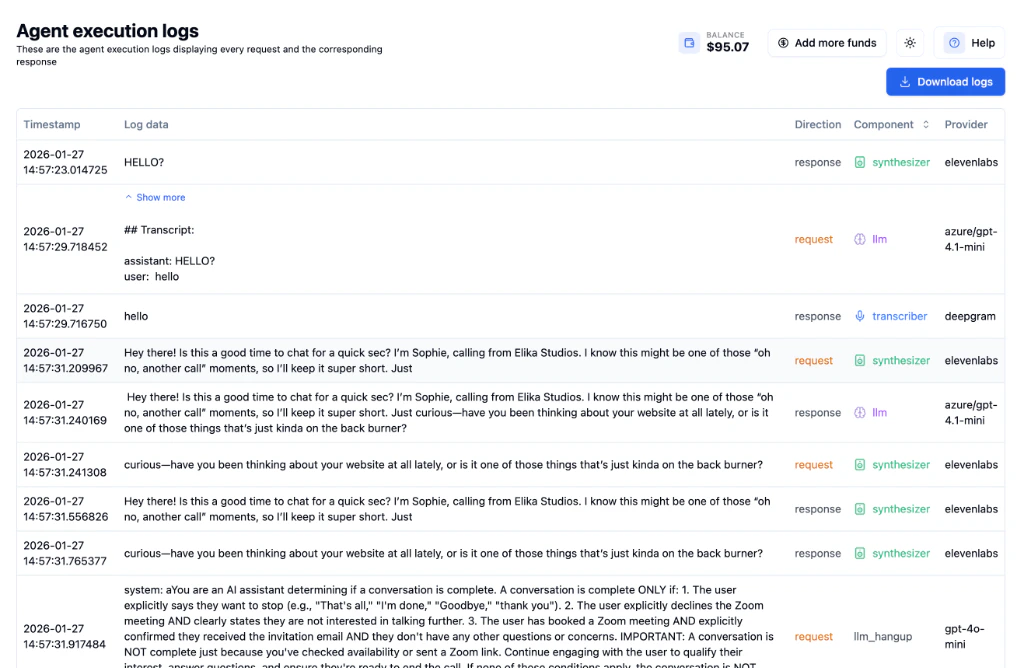
Click the Trace Data icon to view detailed execution logs for debugging. Column Description Timestamp Exact time of each log entry Log Data The actual request or response content Direction Whether it’s a request or response Component Which component handled it (synthesizer, transcriber, llm) Provider Provider used (elevenlabs, deepgram, azure, etc.)
Trace data is essential for debugging! Use it to identify latency issues, transcription errors, or unexpected LLM responses.
Click Download logs to export all trace data for detailed analysis.
Click the Raw Data icon to view the complete JSON execution data. The raw data format matches the Get Execution API response, making it easy to integrate with your systems programmatically. Quick Actions Action Description Refresh Reload the call list Stop Queued Calls Cancel pending calls in the queue Download Records Export call data as CSV
Export call data as CSV for analysis in spreadsheet tools or to share with your team.
Next Steps